
Assessing the state of a modern electricity grid is a complex, data-driven challenge. Weather, asset health, loading behaviour, billing accuracy, outages, and other factors influence how different parts of the grid, also known as grid segments, perform over time. Within Awesense, our segment analysis capabilities started in a familiar place: integrating simple tabular inputs and basic calculations to help teams focus on the most important areas of the grid. Over time, that foundation evolved into a comprehensive, configurable segment analysis framework — designed to scale across datasets, support richer transformations, and surface results directly in the True Grid Intelligence (TGI) web app graphical user interface (GUI) feature we call the “Segment Analyzer”.
This post walks through that evolution and explains how segment analysis in the Awesense Platform enables utilities to move from static assumptions to continuous, explainable grid insight supporting a wide range of analysis types.
What do we mean by Segments?
A core piece of most grid analysis workflows is topological segmentation — dividing the distribution grid into meaningful, connected sections that reflect how the grid is actually built and operated. Unlike consumer segmentation (grouping customers by behaviour, characteristics, or other attributes), topological segments represent real pieces of infrastructure that field crews can investigate, isolate, and act on.
In practice, segments are defined based on the grid’s topology and connectivity. The platform uses the grid structure (with its interconnected assets such as lines, transformers, switches, and downstream customers) to create operational segments. Segmentation can be run on demand and refreshed as grid data changes, ensuring the segment map remains aligned with the latest view of the grid.
What Is a Segment Analysis?
With segments in place, Segment Analysis provides a consistent way to evaluate and compare all segments across a grid with respect to one or more criteria or metrics. To compute these, it applies a consistent, weighted mathematical evaluation across each segment and produces a sorted or ranked view of the entire grid — helping teams spot outliers and prioritize the highest-impact actions, from investigations and field work to asset renewal and maintenance planning.
A Brief History of Segment Analysis
Early segment analysis efforts were pragmatic but limited. Initial versions relied heavily on spreadsheets and manual handling, which made scaling and consistency difficult.
Over time, the workflow evolved toward a more structured and repeatable approach. Early attempts introduced simple segmentation and a single, fixed set of segment settings per customer. While useful, these approaches required frequent manual updates involving deep database access and complex SQL transformations.
As grid data volumes increased, nightly batch processes were introduced to monitor grid behaviour and ensure always updated data in the Awesense Platform. This amplified challenges for segment analysis: limited automation, inflexible weighting schemes, and an inability to easily adapt analyses as new data sources became available.
The takeaway was clear — grid and segment assessment needed to become more dynamic, transparent, and accessible.
Introducing Complex Segment Analysis in the Awesense Platform
Modern segment analysis in the Awesense Platform is built around flexibility and scale. Instead of hard-coded logic and manual aggregation, users can:
- Import well-structured CSV data keyed to grid elements and time ranges
- This optional operation is available via APIs or the Segment Analyzer user interface (UI)
- Define reusable factors directly from all kinds of available data (whether imported via the Segment Analyzer or already present/flowing into the platform automatically via established data pipelines)
- Apply transformations and aggregations that reflect real-world relationships
- Combine multiple factors into a clear, explainable analysis – create an analysis
- Apply the analysis to all or a subset of the desired segmentation
- Visualize results directly in the Segment Analyzer

This shift enables utilities to move beyond one-size-fits-all analyses and instead tailor segment-level analysis to their specific operational priorities.
Building a Segment Analysis: Step by Step
1. Define Your Data Format [Optional]
Users start by defining how external (to be ingested) data maps into the grid data already ingested in the platform. This includes specifying keys (such as grid element IDs), time formats, and one or more value columns. Once defined, data can be uploaded repeatedly without additional configuration.
2. Upload and Explore Data [Optional]
Uploaded CSV files are automatically stored and made accessible through platform APIs. This allows users to validate inputs and confirm that uploaded data aligns with expectations before it is used in calculations.
3. Transform Raw Signals into Segment Factors
Raw data rarely tells the full story on its own. Segment factors allow users to define calculation trees where raw values are combined and transformed using configurable operations. These transformations can represent differences, ratios, trends, thresholds, or aggregations across segments, as well as across time. In particular, using these aggregations, factors can be defined over any kind of time series data that is already present in the platform.
Each segment factor is reusable, meaning the same calculation can contribute to multiple analyses.

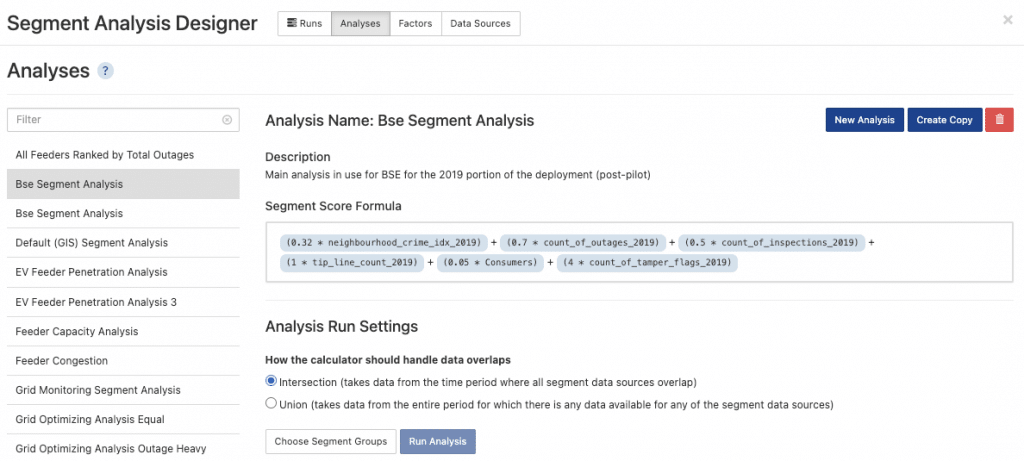
4. Combine Factors into a Segment Analysis
A segment analysis combines multiple segment factors into a single score or assessment value. Each factor is assigned a coefficient that determines how much it increases or decreases the overall result. Coefficients can be positive or negative, allowing the analysis to clearly represent how each factor contributes to the final segment assessment.
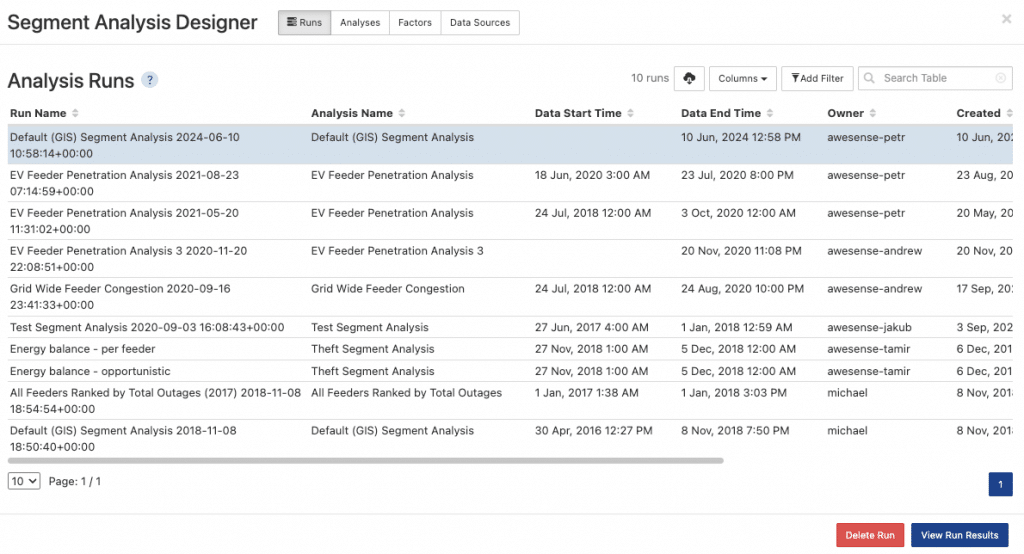
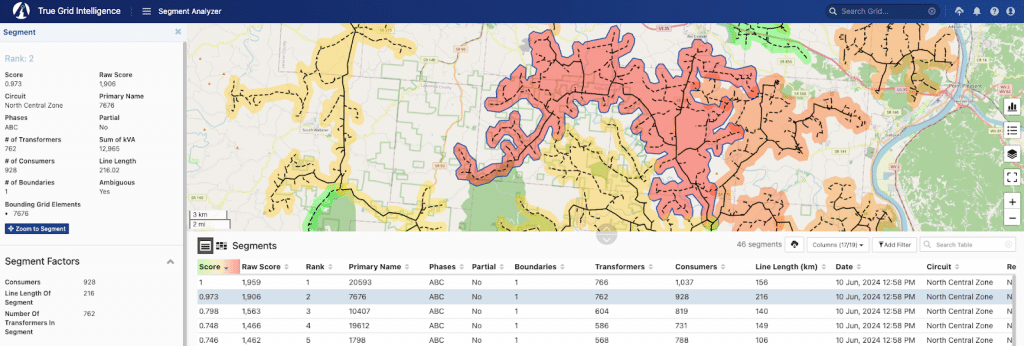
5. Apply and Visualize
Once defined, an analysis can be applied to grids or selected segments. Each application generates a segment analysis “run” whose outcomes can be explored through tables and map-based visualizations. These views allow users to quickly identify and focus on areas with high potential for improvement.
Designed to Grow With You
The segment analysis framework is intentionally extensible. New transformations can be configured through parameters, and additional functions can be introduced as needs evolve. Beyond internal data, externally generated predictions — including outputs from other machine learning systems — can also be imported and used directly as segment factors.
This makes the tool not just an assessment engine, but a general-purpose grid data calculator that supports a wide range of analytical workflows.

From Insight to Action
Segment analysis in the Awesense Platform is about more than numbers. By making assessments transparent, explainable, and grounded in real data, utilities gain a practical way to prioritize work, improve overall grid performance, etc. Just as importantly, it makes advanced segment-level analysis accessible to non-technical users — enabling teams to build, run, and interpret assessments without needing to write code.
What began as spreadsheets and scripts has become a living system — one that adapts as the grid changes and helps teams understand what is happening, where, and why.

Want To Learn More?
If you would like to know more, feel free to explore our related use cases in our Use Case (UC) Library or implementation notes on GitHub:
| Website UC Library | Detailed UC Description on GitHub (access required) | UC Implementation Note on GitHub (access required) |
| [UC22] Topological Grid Segmentation | Link | Link |
| [UC23] Analysis of Grid Segments & Elements | Link | Link |
PS: If you were wondering about the cat memes, they were actually in the original design presentation created by one of our developers, so we just had to include them in this blog post! We really hope they made you smile.